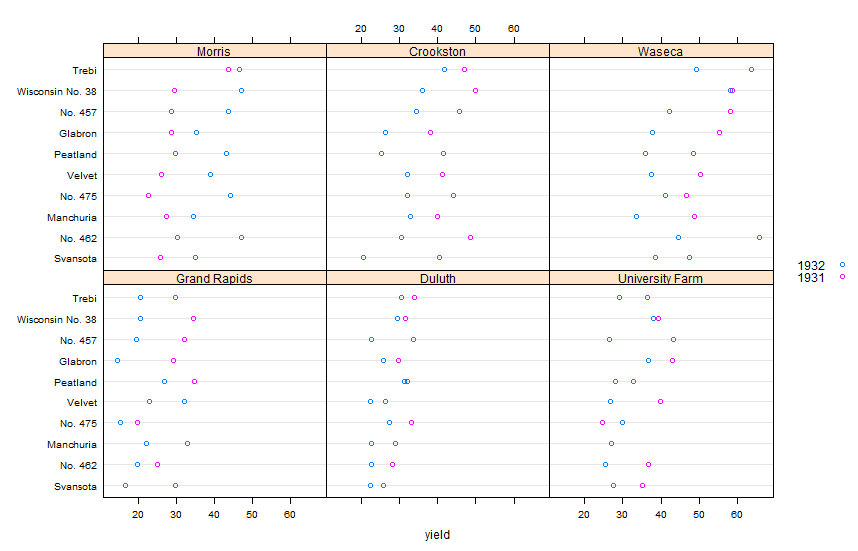
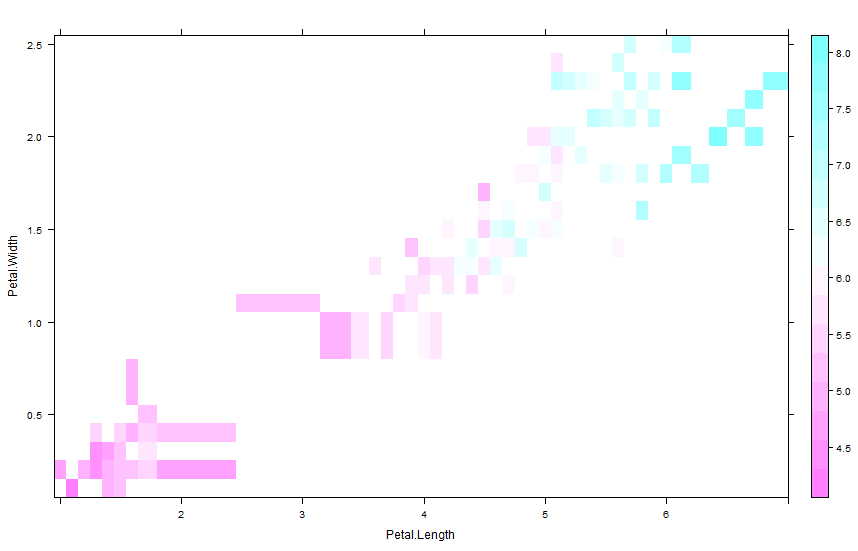
lattice к·ёлһҳн”ҪмқҖ лӢӨліҖлҹү мһҗлЈҢм—җм„ң кё°мӨҖмқҙ лҗҳлҠ” ліҖмҲҳмҷҖ лӮҳлЁём§Җ ліҖмҲҳл“Өкіјмқҳ кҙҖкі„лҘј нҢҢм•…н• л•Ңм—җ мң мҡ©н•ҳлӢӨ.
п»ҝ
| _лҢҖл¬ё | л°©лӘ…лЎқ | мөңк·јкёҖ | нҷҲн”јмҶҢк°ң | мЈјмқёлҶҲ |
|
FrontPage › ScriptBackup › SSIS-CodePageліҖнҷҳ › 3м—°нҢЁ › GetPerformanceTipsDirectlyFromSQLServer › lattice
|
|
|
lattice к·ёлһҳн”ҪмқҖ лӢӨліҖлҹү мһҗлЈҢм—җм„ң кё°мӨҖмқҙ лҗҳлҠ” ліҖмҲҳмҷҖ лӮҳлЁём§Җ ліҖмҲҳл“Өкіјмқҳ кҙҖкі„лҘј нҢҢм•…н• л•Ңм—җ мң мҡ©н•ҳлӢӨ.
п»ҝ
|
мӢңк°„лҸ„ кұёлҰ¬кі м–ҙл ӨмӣҖлҸ„ л§ҺкІ м§Җл§Ң м§җмқ„ м§ҖлҠ” мҡ”л №мқ„ н„°л“қн•ҳкІҢ лҗҳл©ҙ м°Ёмё° мқёмғқмқҙ к°ҖлІјмӣҢ진лӢӨ. (L.M.мҳ¬м»·) |