푸리에 변환은 함수f(x)를 시간 도메인에서 주파수 도메인으로 옮기는거다. 뭐 이런 병신같은 설명이 있는지..
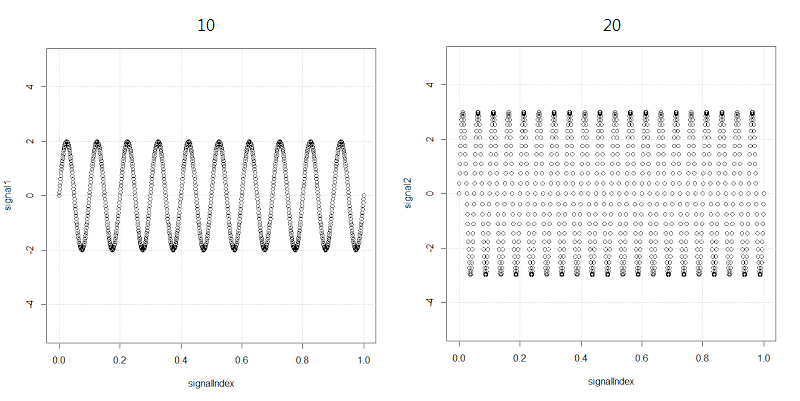
편의상 게임에 10일마다 방문하는 사람과 20일마다 방문하는 사람이 있다고 하자.
![[http]](/moniwiki/imgs/http.png) 출처(http://www.abstractnew.com/2014/04/the-fast-fourier-transform-fft-without.html)
출처(http://www.abstractnew.com/2014/04/the-fast-fourier-transform-fft-without.html)
#set the sampling frequency
samplingFrequency = 1000;

#create the indexes to sample at
timeInterval = 1/samplingFrequency;
signalIndex = seq(0, 1, by=timeInterval);

#amplitude of signal 1
a1 = 2;

#amplitude of signal 2
a2 = 3;

#frequency of signal 1
f1 = 10;

#frequency of signal 2
f2 = 20;

#10 Hz Sine wave with peak amplitude 2
signal1 = a1 * sin(2 * pi * f1 * signalIndex);

#20 Hz Sine wave with peak amplitude 3
signal2 = a2 * sin(2 * pi * f2 * signalIndex);

#input signal is the sum of two signals in this case with frequencies 10 and 20 Hz
inputSignal = signal1 + signal2;
두 사람의 주기 그래프를 합치면 다음과 같을거다.
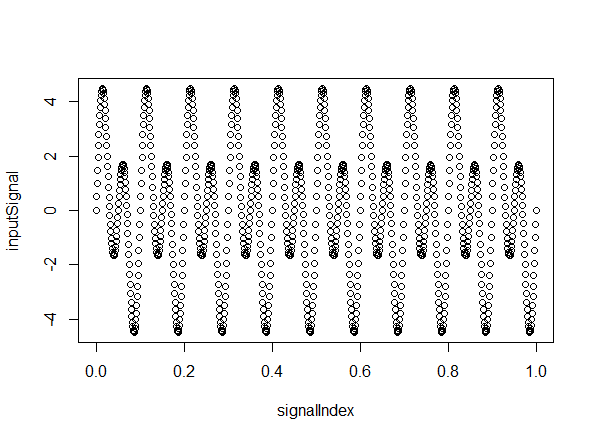
여기부터가 시작이다. 위의 데이터에서 주기 성분을 추출해 보자는게 푸리에 변환이다. R에는 기본적으로 fft(고속 푸리에 변환) 함수를 제공한다.
fourierComponents = fft(inputSignal);
plot(abs(fourierComponents[1:50]))

x축의 10과 20에서 튄거거 보일거다. 나머지는 잡음이다. y축은 세기다.
푸리에 변환은 급격한 변화에 취약하다. 이런 경우 웨이블릿 변환하자.
 Using_R_for_Smoothing_and_Filtering.pdf
![[-]](/moniwiki/imgs/plugin/arrup.png "[-]")
![[+]](/moniwiki/imgs/plugin/arrdown.png "[+]")